LI: to read the text, gather, sort, graph, and analyse the data.
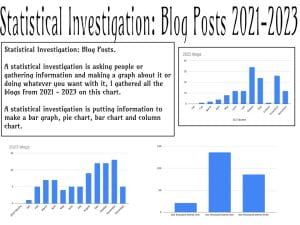
Our task was to make a statistical investigation about or blog posts, between 2021 – 2023 (Year 8’s: 2020 – 2023).
First I found how much blog posts I did in that month (in that year as well), Then I made a Google spreadsheet and put the years and the numbers and I made a chart with all the months.
Next I made a “2022 chart” and a “2023 chart” I also found the amount of blogs I did in that month. I gathered all the blogs from 2021 – 2023 on this chart.
I enjoyed this task because I got to find how much blog posts I did in those months.